Wednesday, March 29, 2017

Accounting for College Costs

A few weeks ago, I read this piece on cost disease from SSC, and it got me thinking. The question is simple: why are costs of certain things, most notably education and healthcare, skyrocketing so quickly, with relatively little improvement in quality?


The SSC piece discusses the problem in general and brings up lots of interesting stuff, but it overlooks a key piece of the puzzle: there are really two questions here. One question is purely an accounting question: costs keep rising faster than inflation, so where is all that extra money going? The second is an economics question: knowing where all the money’s going, why is so much money going there? A complete answer should address both questions.


Here, I’m going to focus on college costs, especially for 4-year private nonprofit colleges.


Part 1: Accounting
College costs keep rising, so where is all that money going? The nice thing about this question is that it’s very simple to answer, in principle. For any particular college, if you had access to the books, you could simply look through all the expenditures, add it up, and see how expenditures changed over the years.


I don’t know of any college which puts its books on the internet for all to see going back to the ‘60’s. (If you do have access to the books for any particular college and would be willing to let me run this analysis on them, please let me know!) But there is the National Center for Education Statistics, which compiles some high-level accounting data on all colleges in the US, and publishes an annual digest.


Let’s start at the beginning: what’s the cost of college, by year?
Source here. This is undergraduate tuition & required fees at 4-year colleges. Data separating private nonprofit/for-profit only goes back to 1999, because enrollment in for-profit colleges was negligible prior to the late ‘90’s. Note that all costs in this post, both in the graphs and the discussion, are adjusted to 2013 dollars.


From here on out we’re going to focus only on private, nonprofit 4-year colleges from 1999 to 2013, because that’s what the Digest of Education Statistics has data on. (Again, if anyone can find good data back to the ‘60’s, please let me know!)


We’re going to follow the money on its journey.


From tuition, comes revenue for colleges. Let’s make sure the payments arrive safe and sound…
(Source; FTE = full-time enrolled student; all graphs from here on out show inflation-adjusted costs per FTE per year unless otherwise specified.)


Well that’s informative! If you’ve been to a private 4-year nonprofit university lately, you probably noticed that most people don’t actually pay the sticker cost. This data makes it pretty clear: actual expenditure on tuition is a lot lower than the sticker cost suggests. More to the point, nominal tuition grows much faster than actual tuition revenue. From 1999 to 2013, nominal tuition grew by 42.0% (about 3% per year), whereas tuition revenue grew by 23.7% (about 1.7% per year).


So roughly half the supposed growth in private college cost comes just from the games colleges play with their sticker-price tuition. If we look at what students actually pay - what colleges actually receive in tuition revenue - growth is lower by a factor of two.


But we’re not done yet! Remember, these numbers are all inflation-adjusted, so the remaining 1.7% annual growth is still 1.7% on top of inflation. So, we still want to know why college costs are growing faster than inflation.


Before we move on to expenses, a little more on revenue. Tuition revenue is less than half the revenue of private nonprofit colleges. Most of the rest comes from a combination of federal/state grants, private gifts, and investments. Key facts:
  • Grants and gifts cover the lion’s share of non-investment revenue, but they’re roughly flat from 1999-2013.
  • Investment revenue is very noisy, and colleges mostly don’t rely on their portfolios to cover costs.
  • Other than a rise in profits from hospitals, tuition was the only category of revenue to grow significantly and steadily.
I don’t want too much data-clutter, so the relevant graphs are at the end of the post. The important takeaway here is that, even though tuition is less than half of colleges’ revenue, it absorbs pretty much all of the growth in expenses.


With all that in mind, let’s look at non-investment revenue compared to expenditures.
That’s comforting: non-investment revenue is pretty close to expenditures. (Source) This is a good justification for ignoring investment revenue. As expected, both non-investment revenue and expenditures are growing steadily.


Now, how do all those expenditures break down?
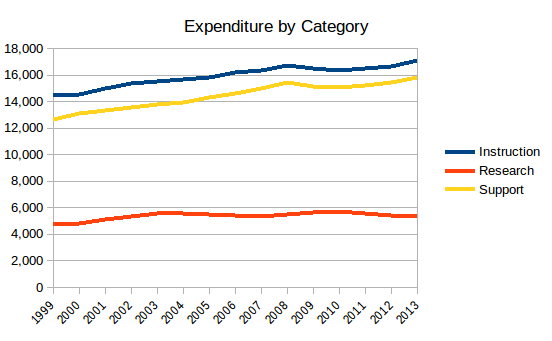
Again, everything is per FTE per year. So support cost (student services, academic and institutional support) is roughly comparable to instruction cost (teaching), and the two have risen at similar rates in the 1999-2013 window. Research expenditures, meanwhile, have been pretty flat.


Between them, support and instruction expenditures added about $5800 per FTE during this period, while (actual) tuition only increased by about $3900. What about the other $2000? About $1000 of it came from cutting expenses in public service, grant-based financial aid, and other costs. Another $1000 came from net profit in university-owned hospitals, which became quite profitable during this period.


So colleges really have been tightening their belts, cutting back on things like public service and grant-based financial aid, making money off their hospitals… and all the money from that belt-tightening, along with tuition increases, has gone back into paying professors and staff.


Let’s keep following the money. Next stop, professors and staff. Why are costs for instruction and support increasing faster than inflation, year after year?


Well, as the professors will tell you, it’s not their salaries. Inflation-adjusted average instructor salaries rose from $81500 to $87000 over the period (source). Full professor salaries rose a bit more, and were offset by dramatically increasing numbers of graduate assistants and associate professors and whatnot. Bottom line, average inflation-adjusted salaries increased, but not enough to account for the growth in expenditure.


The bigger factor was a decrease in student-faculty ratio. The Digest only gives numbers for 1993, 2003, and 2013, but from 2003 to 2013, the student-professor ratio dropped from 11.9 to 10.6 at private nonprofit colleges. That’s a 12% increase in professors per student. Combined with the 7% increase in salary, that’s just about right to account for the 18% increase in instruction costs.


The data in the digest does not provide a clear story about the increase in support expenditure; it doesn’t have much information on non-instructional staff other than the expenditures. Based on the data for instructional cost, we can speculate that the picture is similar: a moderate increase in salaries beyond inflation, combined with growth in support staff per student. Just a hypothesis for now, but it seems like a pretty plausible guess.


Summary
We started with the sticker price of tuition, and immediately saw that sticker price is much larger and grows much faster than the actual tuition revenue per student (at least at private 4-year nonprofit colleges/universities). So a big part of the growth of cost in college is that colleges play games with the sticker price, which doesn’t really reflect the actual tuition paid. But that only accounts for half the inflation-adjusted growth, so we have to keep looking.


Next, we followed the money: from tuition and other revenue to overall expenditures to expenditures by category and finally to student-faculty ratio, which is the main driver of cost growth over this period (along with its support-staff equivalent).


Unfortunately, the relevant revenue and expenditures data from the Digest only goes back to 1999, whereas rapid growth in college prices started around 1980. Were student-faculty and student-staff ratios the main source of cost increases all along? I expect the answer is yes, although this data set doesn’t go back far enough to check. One quick sanity check for law schools in particular is provided by the Bar Association:
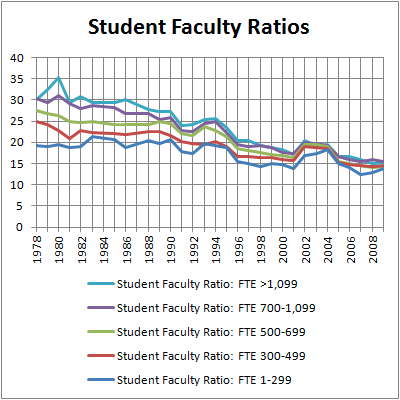
(Source). Sure enough, student faculty ratios at law schools have fallen steadily since the early ‘80’s, by a factor of 2 for the largest schools. So it’s quite plausible that student-faculty ratios have been the main source of cost increase all along.


In fact, I suspect that the increase in faculty per student is also a big driver of the increase in faculty salaries, since the extra demand will drive up wages… but that’s a topic for the next post.


More generally, where this post was about the accounting questions behind college costs, the next will be about economic questions. This post asked “where?”, “what?”, and “how?”; next post will ask “why?”. Why did student-faculty ratios fall? Why are students willing to pay so much? Why did sticker prices become disconnected from actual costs?

Update: Actually, the next post is a little more accounting. But it's getting closer to the economics questions.

Appendix: Stray graphs
All sources for these graphs were linked above. All costs are per FTE per year, for private nonprofit 4-year institutions, adjusted for inflation.
Investments: large and noisy, but mostly just keep to themselves.


All the other revenue sources. Note that tuition and hospital revenues are the only categories to show consistent growth.

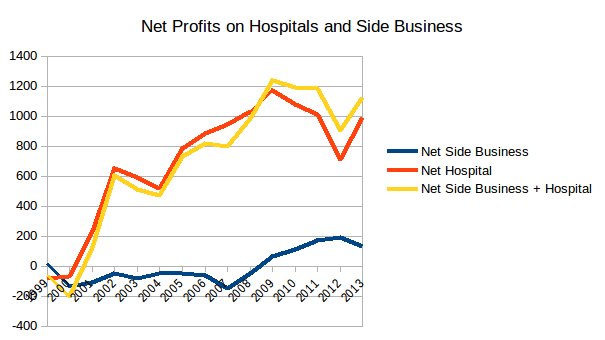
Profits from university hospitals increased from zero to about $1000 per FTE.


Slightly more granular support expenditures.

Friday, March 24, 2017

Game Theory and Branding

1.Brand as a Meet-up Point
The game theorist Thomas Schelling came up with the following game: you and one other person are dropped at different locations in New York City, with no way to communicate. You both pick a time and place to try to meet up. If you both pick the same time and place, then you win!

This sort of game is incredibly common in business. Imagine that, instead of just two people, there are two groups of people. One group all have t-shirts which say “buyer”, and the other group all have t-shirts which say “seller”. Each person wins if they can meet up with someone from the other group - each buyer wants to find a seller, and each seller wants to find a buyer.


One really good solution to this sort of problem is to put up a giant billboard that says “Meet up here!”. In a business context, a strong brand can serve that role. Ebay is a great example - everyone knows that ebay is where you go to sell random stuff to strangers, and everyone knows that ebay is where you go to buy random stuff from strangers. Ebay serves as a meetup place for buyers and sellers, and the ebay brand is the game-theoretic equivalent of a giant billboard which says “Meet up here!”.


Why it’s valuable

This sort of brand value usually involves network effects - the more people meet up under your billboard, the more people will recognize it as a good place to meet up. If only 1% of people go to your billboard to meet up, then it really isn’t a very good place to go. But if 90% of people go to your billboard, then it’s the obvious place to go and you’d be an idiot to go anywhere else. That makes this sort of branding incredibly valuable, since you can effectively lock in a market - once ebay becomes the place to go to buy and sell random stuff, nobody will bother going anywhere else, and ebay can rake in the money.

In particular, that means the company is willing to pay lots of money for their billboard - i.e. maintain the brand through advertising. Especially early on, the company may spend very heavily on advertising in order to jumpstart the network effect.


In general, when you hear about a “network good”, it’s always a good with this sort of underlying coordination game structure. This includes goods from markets (ebay, uber, NASDAQ), to messaging (snapchat, whatsapp), to standards (VHS vs Betamax), to Facebook, the internet, and so on.


When not to do it

Notice that this whole setup depends crucially on the structure of the problem - buyers looking for sellers, in the ebay example. In general, this kind of brand value applies ONLY if the company exists to solve a coordination problem (a game where players win by “coordinating” on the same solution, i.e. meeting up at the same location). If that’s not the central purpose of the company, then this kind of branding does NOT apply.

2.Brand as a Signalling Mechanism

Nobody buys a macbook because of the computer’s inherent value. No, people buy macbooks so that they can be seen in coffee shops wearing scarfs and presumably typing up modern poetry on their macbook.

Ok, I’m exaggerating a little bit. But macbooks don’t sell for $1000 because of the material cost. (And don’t give me that “but I need it for coding!” crap; you’re probably just running the code in a linux VM anyway.)


iOS vs Android. Lexus vs Toyota. Rolex vs Timex. Signalling brands are all about selling the same shit, or even worse shit, for a higher price. Why would anyone buy such products? Because everyone knows they’re higher priced, so they’re a great way of showing off how fabulously wealthy you are.


Alternatively, signalling can show off how morally upstanding you are. Target vs Walmart, Prius vs cars which go vroom, Whole Foods vs Albertson’s… there are no shortage of opportunities to spend a little extra in order to show everyone how concerned you are about poor people, climate change, or poor people impacted by climate change.


Why it’s valuable

In this kind of branding, the brand IS the product. You’re also selling a nominal “product”, but that’s really just a vessel for the brand - just like Abercrombie shirts are often just vessels for the word “Abercrombie”. The shirt itself costs $10, the other $80 are for the brand. The good news is, it costs basically nothing to stick the brand on the shirt (or phone, or watch, or car, or whatever), so profit margins can be outrageously high.

Of course, you’ll need to spend heavily on advertising in order to build the brand identity. It’s not a completely free lunch. Indeed, everyone wants to claim a slice of this pie; this kind of branding will pit you against lots of competition.


When not to do it

Signalling is all about visibility. The whole point of a Rolex is that other people see it, so they can see how wealthy you are. The whole point of a Prius is that other people see it, so they can see how morally upstanding you are. The whole point of a Tesla is that other people see it, so they can see how wealthy and morally upstanding you are.

Corollary: if you’re selling something which is not highly visible, then it’s not a signalling good, so don’t bother with this kind of branding. For example, I’m currently at a mortgage company. Nobody would pay an extra-high rate on their mortgage to show how rich/moral they are.


Now, I can hear all you product managers out there thinking “I know! We’ll make it visible by adding a button to share on social media!”. Ok, please imagine Rolex adding a button to share “I just bought a Rolex!” on facebook. Clearly, anyone who actually shared this would immediately be labelled a desperate plebeian. Not good. That’s why signalling goods need to be inherently visible - whether you’re signalling wealth or morality, you have to pretend you’re not just showing it off.


3.Brand as a Trust Mechanism

In contract law, one of the first lessons a student learns is that contracts come with two rights: the right to sue, and the right to be sued. The latter often comes as a surprise, but it is arguably the more valuable of the two. If a person or company can be sued for screwing me over, then I can trust them not to screw me over (or at least not enough to merit a lawsuit). That sort of trust is necessary to enable business transactions, so it’s actually valuable to be able to be sued.

Practically, however, lawsuits are both expensive and risky. In most cases, a company has considerably more legal resources than a consumer. That means that the right to be sued is, for many companies, more a theoretical than practical threat. And since the ability to be sued means the ability to be trusted, a practical inability to be sued means a practical inability to be trusted. In short, companies with the legal resources to fight a lawsuit are not trusted.


Branding can be used as an alternative mechanism for trust.


How? Well, the right to be sued creates trust because the company can be hurt (via lawsuit) if they do something bad. Similarly, regularly screwing over consumers will ruin a brand, as word inevitably gets around that the company is no good. Consumers intuitively trust brands they’ve heard of (and haven’t heard bad things about), because if those companies screwed their customers, then word probably would have gotten around by now.


Why it’s valuable

The value in this sort of branding depends on how much trust matters. In general, trust is more important for larger-ticket items (cars, houses), online sales (since you can’t hold the item before buying it), and things consumers don’t understand well (lawyers, doctors). All of these cases create strong opportunities to screw a consumer over, so there needs to be a corresponding high level of trust.

When not to do it

Do NOT build a brand if you’re going to screw people over. This seems really obvious, but most US airlines, most cell phone carriers, Comcast, and the entire insurance industry apparently do not get it.

Pharma companies, on the other hand, have this one totally nailed down. I have no idea who makes the last few prescription pills I took.


Aside from having a negative-value brand, it’s worth thinking about whether a brand will have zero-ish trust value. For inexpensive items which consumers understand well (or at least think they understand well), trust probably isn’t a big deal, so this kind of branding isn’t going to add much. For instance, people hopefully trust the security of their google accounts more than the security of their yahoo accounts, but trust isn’t all that central to google’s value - they’re not selling confusing, big ticket items.

Tuesday, March 14, 2017

Four Parables, One Lesson: The Broken Chain Problem

The Emperor’s Nose (Richard Feynman)

A village in a remote corner of an empire decided to erect a statue of the emperor. The village sculptor was hired, but the sculptor had no idea how large to make the emperor’s nose.

The elders conferred. Nobody in the village had ever seen the emperor, nor heard anything about his nose, so they all had wildly different estimates of the size of the emperor’s nose. The elders argued about the right size for hours, until one particularly wise elder stood to address the room.

“Our estimates are too noisy,” the wise elder declared, “In order to improve them, we should employ the wisdom of the crowd. We will ask each person in the village to estimate the length of the emperor’s nose. Then, we can average together the results to obtain an estimate of high precision.”

This proposition was put to a vote, and the elders quickly agreed, eager to end the hours of argument before they missed the early-bird special at the village buffet. The next day, each villager was asked to estimate the length of the emperor’s nose, in millimeters. The elders averaged together all the responses, and estimated the emperor’s nose was 15.49 mm long.

The Cargo Cult (Feynman again)

During World War II, many remote pacific islands became military bases for the American navy. On one such island, the native inhabitants worked with the sailors in exchange for food, clothing and other supplies. All these supplies were flown in by plane, and landed on an airstrip.

After the war, the Americans left the empty airstrip behind. The planes stopped delivering supplies.

The natives wanted to get more supplies. So, they tried to make the planes land. 

They went out to the airstrip and did everything the sailors had done. They lit small, regularly spaced fires along the sides of the airstrip. They had someone sit at the side of the strip talking into a wooden box while wearing pieces of wood shaped to look like headphones. They had others stand on the airstrip and gesture with sticks. In short, they did everything they had seen the sailors do.

But the planes just didn’t land.

The Missing Quarter (Boy Scout tradition)

A boy was pacing back and forth at night under a streetlamp, apparently searching the ground, when another boy passed by.


“What are you looking for?” asked the newcomer.

“My quarter. I dropped it,” replied the searcher.

“Oh. I’ll help you look,” offered the newcomer.

The two continued the search for a minute or so before a third boy came along.

“What are you two looking for?” asked the third.

“A quarter he dropped,” replied the second, indicating the original boy.

“Let me help,” said the third, and set to searching.

This continued for some time, and the crowd grew steadily. Finally, a girl showed up.

“What are you all looking for?” she asked.

“My quarter. I dropped it,” replied the original boy.

“Well where did you drop it?” asked the girl.

“Over there,” said the boy, indicating an area off to the side.

“So why is everybody searching over here?” asked the girl.

“Because there’s more light here,” replied the boy.

The Soviet Nail Factories (Historical/Folklore)

The soviets' central economic planners regularly set targets for each factory under their control. Factories which exceeded their targets were rewarded in various ways. Factories which fell short of their targets… well, it’s the soviets, you can figure it out.

Early on, nail factories each had to produce some number of nails to meet their target. For a while, things went well. Factories produced nails. But there was always an element of competition - the best-performing factories received rewards and the worst-performing were punished, so occasionally people would cut edges in order to get ahead.

In particular, the nail factories found that they could gain an advantage by producing slightly smaller nails than the competition. By producing smaller nails, they could produce a larger number with the same resources. But over time, all the nail factories figured this out, and they had to cheat a little more to gain an edge - the nails became even smaller.

This arms race continued until each factory was producing large numbers of tiny, useless “nails”, better suited to pinboards than to construction.

The central planners heard reports of the tiny nails. They decided to update their targets - henceforth, nail production would be measured by weight, rather than number of nails.

A few years later, all the nail factories were producing just a few giant, useless “nails”, better suited to ballast than to construction.

The Lesson: Don’t Pull a Broken Chain

In everyday life, things are connected by chains of cause and effect. 

Suppose I’m driving along at night when a deer wanders into the road ahead. Light from my headlights reflects off the deer’s hide, into my eyes. The light is absorbed by photoreceptors, which trigger a cascade of electrical signals in my brain. My brain pattern-matches what it sees, and concludes that there’s a deer ahead and hitting it would be bad. The chain of cause and effect links the deer in the road, to me realizing there’s a deer in the road.


Once I realize there’s a deer in the road, electrical signals propagate down my spine to neurons in my leg and foot. Those neurons activate muscles, lifting the foot from gas to brake pedal and then pushing. That force depresses the brake pedal, which applies pressure in a hydraulic system, multiplying the force and eventually squeezing disks connected to the wheels. The increased force on the disks increases friction, slowing the wheels, which in turn slows the car. The chain of cause and effect links my decision to brake, to the car slowing down.

In everyday life, we pull on chains of cause and effect, either to gain information or to influence the world around us. But in each of the four parables above, the chain is broken.

In the story of the emperor’s nose, the elders try to estimate the nose length using statistical techniques… but none of the townspeople know anything at all about the emperor’s nose, so the causal chain from the actual emperor’s nose to the elders’ estimate is broken.

In the story of the cargo cult, the locals mimic the surface actions of sailors at an airstrip, but they don’t understand the underlying chain of cause and effect which led planes to land. Absent that underlying chain, the planes don’t land.

In the story of the missing quarter, the first boy searching under the light causes the second boy to search under the light, and the third, and so on. But the first boy is searching in the wrong place - the chain is broken at the very beginning, even before the story starts. In fact, the first boy himself is pulling on a broken chain: light is helpful for searching, because the light might bounce off the quarter and into the boy’s eye etc. But if the light will never bounce off the quarter - because the quarter isn’t under the light - then that chain is broken.

The Soviet nail factory is the most complicated story. In a normal economy, a nail factory produces an economically valuable nail. That nail is sold, and the nail will only be bought if it’s valuable to the buyer (and the more valuable it is to the buyer, the more the buyer is willing to pay for it). The money from the buyer goes back to the nail maker, and serves as incentive. This chain of cause and effect runs from the nail makers producing an economically valuable nail, to the nail makers being rewarded for whatever value the nail provided for the end user.

But once the central planners step in and set targets in terms of number or weight of nails produced, the chain is broken: the nail makers are no longer rewarded based on the economic value of the nail to its end user. So naturally, the nail makers deprioritize economic value in favor of number or weight of nails. (This is a standard example of Goodhart’s Law: when a measure becomes a target, it ceases to be a good measure. Goodhart’s Law itself is is a special case of the broken chain problem.)

To summarize the lesson: don’t pull a broken chain. When you want to gather information, make sure that the thing you want to know about is causally connected to the thing you’re looking at directly. When you want to influence the world around you, make sure that your action is causally connected to whatever you want to influence. If the causal chain is broken, don’t pull it.

Wednesday, March 8, 2017

Refutation of Summers' Hypothesis for the CS Gender Gap

Summers' Hypothesis is a widely-cited hypothesis purporting to explain gender spreads in academic/occupational fields, especially STEM fields. The idea is that gender spreads are driven by difference in variance of individual intelligence. Specifically, intelligence variance is higher among males, meaning that more males have either very high or very low intelligence, even though average intelligence is roughly the same across genders.

(The hypothesis is named for Harvard president and US Treasury secretary Larry Summers, who became a liberal pariah shortly after floating the hypothesis in public.)

The key word here is variance. I’ve seen lots of “refutations” of Summers' hypothesis which take a bunch of IQ data, and show that the average is the same (or at least very close) between the two groups. But that’s not actually Summers' hypothesis: the hypothesis states that the variance is different, and that difference explains the gender gap. I’ve never seen any popular media present a correct refutation of the hypothesis, so that’s what we’re going to do here.

We’ll focus on the gender gap in computer science. We’ll compute what gender gap we’d expect based on Summers' hypothesis, then compare that to the real gender gap.


Down to business. To start off, we need three key numbers: IQ variances for males and females, and average IQ for computer scientists.


The average IQ for computer scientists is fairly straightforward: SAT scores do a good job of measuring IQ, and there’s data out there on SAT scores by major. In fact, people have even crunched the numbers already! We’ll use the IQ-by-major estimates here; this source lists an average IQ of 124 for computer and information science majors.


IQ variance for males and females is trickier: it’s been the subject of considerable debate thanks to Summers' hypothesis, so of course people of various political stripes have published heavily-biased “studies” and arguments trying to prove their views. I’ll pull from this study. I like this study for several reasons:

  • It uses sibling pairs, so lots of potential confounders are controlled for 
  • The sample size is large (~1200 sibling pairs) 
  • It draws from the US National Longitudinal Survey for Youth, so it’s fairly representative of the US population 
  • The authors are careful to address g-factor specifically 
In short, the study is really carefully done from a technical standpoint.
Anyway, that study found a male intelligence standard deviation about 1.11-1.16 times the female standard deviation, depending on the exact measure used. Also noteworthy: the males had significantly higher variance on all but two subtests. (Difference in mean intelligence was tiny, as expected.)

The next bit involves some math. I’ll omit the calculations, and illustrate what’s going on with a picture:


The picture shows two normal curves. (Intelligence isn’t normally distributed, but it’s a good enough approximation for our purposes.) The taller curve (blue) represents females - I’ve set its standard deviation to 15, which is the usual standard deviation for IQ. The flatter curve (green) represents males - its standard deviation is 1.16 * 15, reflecting the study above.

Right at the mean IQ of 100, the blue curve is noticeably higher - among a sample of people with IQ exactly 100, there should be more females than males (the exact calculation predicts about 16% more). The curves intersect somewhere between 115 and 120, and between 80 and 85. Around these IQ levels, the females and males are about even.


We saw that “computer and information science” majors have an average IQ around 124. At that level, we’d expect about 20% more males than females. Put differently, based only on IQ variance differences, we’d expect about 45.5% of computer and information science majors to be female.


Now, anyone in CS knows that “information science” is a very different field, and those information science folks… well, their reputation isn’t as strong. I suspect that may be dragging down the IQ estimate. So to double-check, I looked here and found an estimated average IQ of 128.5 for computer scientists. At that level, we’d expect about 42% females. Another important factor is that we’re setting female IQ standard deviation to 15 - if we instead set male IQ standard deviation to 15, then we get an estimate of 38% female. This is just a side effect of lazy back-of-the-envelope math; a more careful calculation would be somewhere between the 38% and 42% numbers.


Anyway, Summers' hypothesis seems to predict roughly 38%-45% females in CS, depending on calculation details. What fraction of computer scientists are actually female? According to payscale, computer science is 85% male, 15% female.


So, Summers' hypothesis? Not even close. Differences in IQ variance are nowhere near large enough to account for the gender gap in CS. Other STEM fields are left as an exercise to the reader.

Sunday, March 5, 2017

Vision and Academia

Background: I interviewed for Rice University's graduate program in Systems, Synthetic and Physical Biology (SSPB) on Friday. This post presents an initial reaction; I may flesh it out more in a later post.

I just got back from grad school interviews at Rice. Walking between interviews, I noticed that something felt… off. It took a while to put my finger on it, but I realized what was missing: vision.


In the silicon valley start-up scene, everyone wants to take over the world. Every company either wants to revolutionize their industry, or invent an entirely new gazillion-dollar industry, or completely rewire society. At Carlypso, the goal was to radically reduce the overhead of dealing in used cars by building a zero-inventory online dealership. At my current company, the goal is to radically reduce the time and cost of issuing mortgages by a factor of five. In both cases, we explicitly built everything with global market domination in mind.


Whatever the objective may be, a startup is organized around achieving that objective. Whatever the biggest bottleneck is, that’s the biggest business priority. In established industries (like mortgages and used cars), the bottlenecks for your business are usually the same bottlenecks faced by the whole industry. If you’ve chosen the right industry, then the bottlenecks are the sort of things which can be solved by throwing technology and smarts at the problem, and then you’ve got a formula for a viable tech startup.


In industry, you focus on the main bottleneck because you have to. If you don’t, then the business will flounder. But in academia, that impetus isn’t really present.


You can ask a professor what the big vision is, what they’re working toward, and usually they’ll have something to say about it. Maybe it’s understanding how cells process information, or curing cancer, or kicking off the bioengineering revolution. But then you look at their actual projects, and… well, maybe their projects are sort of tangentially related, but they’re usually not the major bottleneck on the path to their supposed goal.


Look at synthetic biology, for instance. What are the major bottlenecks to the field as a whole? Reduction of cycle time would be the number one item on my list (i.e. reduce time required to design gene drive, fabricate a plasmid, introduce it into cells, grow the cells, observe their behavior, and use the observations to inform design of a new gene drive). Another major item would be better chasses, i.e. cell lines which are simple, predictable and grow quickly. How many researchers are working on these problems? Not many, and even then it’s often a side project.


In fact, a lot of the work on these bottlenecks happens at private companies - they know that a better chassis cell line or new machine which accelerates cycle time will make lots of money. But academics don’t really have a motive to focus on the bottlenecks. Bottlenecks are usually not in areas where many professors have existing expertise - that’s partly why they’re bottlenecked in the first place. Funding boards don’t seem to focus much on addressing bottlenecks. In practice, inventing a new method which becomes widely adopted is a great way to make a name in a field, but I don’t think most academics realize there’s an easy way to do that - look at what the major blockers are, and then address those directly.